Direct Glucose Sensing with Raman Scattering
Dr. Jeon Woong Kang
G.R.HARRISON SPECTROSCOPY LABORATORY, MIT, MA, USA
Background
Dr. Jeon Woong Kang is a research scientist at the MIT G. R. Harrison Spectroscopy Laboratory, developing applications in which Raman spectroscopy serves as a readout for diagnostics of pathologies, such as cancer. Among these applications, one example is the use of a fiber optic Raman probe integrated into medical needles - such as epidural needles - to accurately determine the needle tip’s location within the body. When incorporated into a breast core needle biopsy device, this technology enhances biopsy success by enabling precise targeting of micro-calcifications and allowing for in situ diagnosis. Additionally, a spectroscopy-based tissue scanner can generate diagnostic maps and identify cancer margins from excised tissue, directly in the operating room.
One of Dr. Kang's more recent projects will soon reach clinical trials, focused on non-invasive glucose sensing. Dr. Kang explained his project, “Glucose is one of the flagship projects in the lab, while glucose in solution could be measured since the 1990’s [Berger et al. 1995], and noninvasive concepts for probing already exist [Eneider et al. 2005; Kong et al. 2011], the basic principle to measure it non-invasively brought considerable challenges. If you shine light through the skin, analyze the reflected signal, and if you can somehow extract the glucose signal, then you can do the prediction of the glucose levels... Technically this is extremely challenging. If you are measuring the Raman spectrum from the skin, you usually get a strong background signal from the melanin and haemoglobin. Then there are strong Raman signals from surrounding tissue matrix such as lipids, proteins and collagen... Glucose is a tiny piece of the total signal which can be easily overwhelmed by strong surrounding signals.”
The blood glucose concentration is retrieved by measuring the complete spectrum [Eneider et al 2005] and applying a mathematical model on the measured signal. This method was, however, subjected to criticism from the scientific community mainly due to the difficulties in showing the clear glucose Raman spectrum from the tissue and prospective prediction. Dr. Kang was therefore looking for a more direct readout of the glucose concentration: “my goal was to measure the clean glucose signal from the in vivo skin.”
To circumvent the low throughput of Raman spectroscopy of in vivo skin, Dr. Kang mentions “my approach was using the off-axis geometry.” As displayed in Fig.1a, by illuminating the tissue from the side and collecting emissions with a vertical fiber bundle, “we effectively remove the unwanted specular reflection and a lot of Rayleigh component.”
One of the characteristic Raman peaks corresponding to in vivo glucose is detected at 1125 cm^−1 (as shown in Fig.1b & 1c). Dr. Kang mentions: “The analysis was based on the glucose 1125 peak, so on the single peak information, instead of the using the full spectrum... but from the selected band information we could predict the glucose concentration”. The method presented here leverages the intensity measurement of the observed peak as a direct readout for the glucose concentration which opens promising miniaturization opportunities.
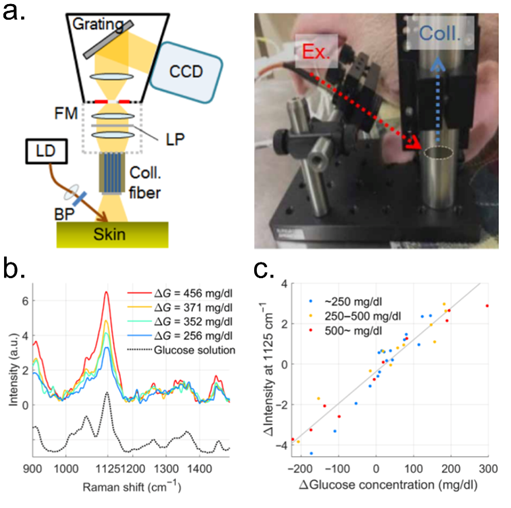
Figure 1: A) Schematic of the in vivo Raman spectroscopy experimental setup (FM: f number matcher, LP: longpass filter, LD: laser diode, BP: bandpass filter) On the right, photograph of the setup with oblique illumination and vertical collection. B) Four substraction spectra at different glucose concentration differences. C) Change in the Raman peak’s intensity scales linearly with change in glucose concentration. (Differential peak intensity: subtraction of time-moving subject-specific spectrum, lagging 20 min behind spectra to be subtracted.) Images taken and modified from Kang et al. 2020.
Challenge
The experimental design has been optimized to maximize the signal to noise ratio at the peak of interest (glucose peak at 1125 cm^−1). Ideally the setup for this experiment has extremely high resolution exactly at the wavelength/wavenumber of interest as the correct measurement of the intensity of the glucose peak is paramount. The detector thus needs to have very low levels of noise and dark current, as the integration time for the experiment is 285s long. Furthermore, to best display the peak, a high spectral resolution is required from the spectrograph.
Solution
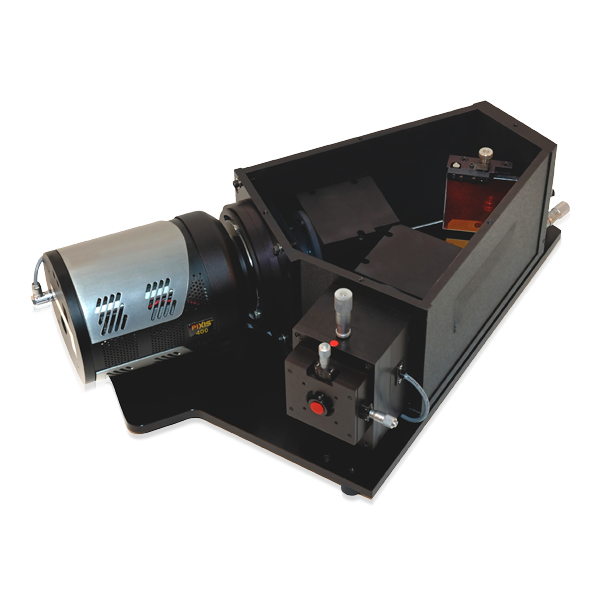
Dr. Kang uses the Acton LS-785 spectrograph combined with the PIXIS 1024 BRX CCD camera, with the whole system being steered with the Lightfield imaging software package. The PIXIS CCD detector is ideal in terms of sensitivity, with a 99% QE maximum and a 13 µm pixel-size. With an acquisition time of 285s, the dark current of 0.0004 e-/p/s (when cooled at -70°C) contributes significantly to the quality of the data and the quantitative measurement of the glucose peak.
The results shown in Dr. Kang's publication [Kang et al. 2020] demonstrate the effectiveness of the instruments and serve as a proof of principle leveraging the various usages of Raman spectroscopy. The study has now reached clinical trials, as Dr. Kang mentions: “Last year and we went through human trials in the MIT Center for Clinical and Translational Research (CCTR) and the data looks pretty promising.” Some final challenges are still being tackled, for example the difference in background resulting from skin inhomogeneities or pigmentation. “When you have an increased background signal because of the increased skin pigment, your prediction accuracy will be affected.” Dr. Kang says.
References
Berger AJ, Wang Y, Sammeth DM, Itzkan I, Kneipp K, Feld MS. (1995) Aqueous Dissolved Gas Measurements Using Near-Infrared Raman Spectroscopy. Applied Spectroscopy. (8):1164-1169. doi:10.1366/000370295396504
Enejder AM, Scecina TG, Oh J, Hunter M, Shih WC, Sasic S, Horowitz GL, Feld MS. (2005) Raman spectroscopy for noninvasive glucose measurements. J Biomed Opt. 10(3):031114. doi: 10.1117/1.1920212. PMID: 16229639.
Chae-Ryon Kong, Ishan Barman, Narahara Chari Dingari, Jeon Woong Kang, Luis Galindo, Ramachandra R. Dasari, Michael S. Feld; (2011) A novel non-imaging optics based Raman spectroscopy device for transdermal blood analyte measurement. AIP Advances 1; 1 (3): 032175. https://doi.org/10.1063/1.3646524
Jeon Woong Kang et al. (2020) Direct observation of glucose fingerprint using in vivo Raman spectroscopy. Sci. Adv.6,eaay5206(2020).DOI:10.1126/sciadv.aay5206